33 Surprising Facts About Car Crashes and Injuries in Pennsylvania

Illustration of a head-on car crash with a red car and orange SUV and an injured individual on crutches with a leg brace.

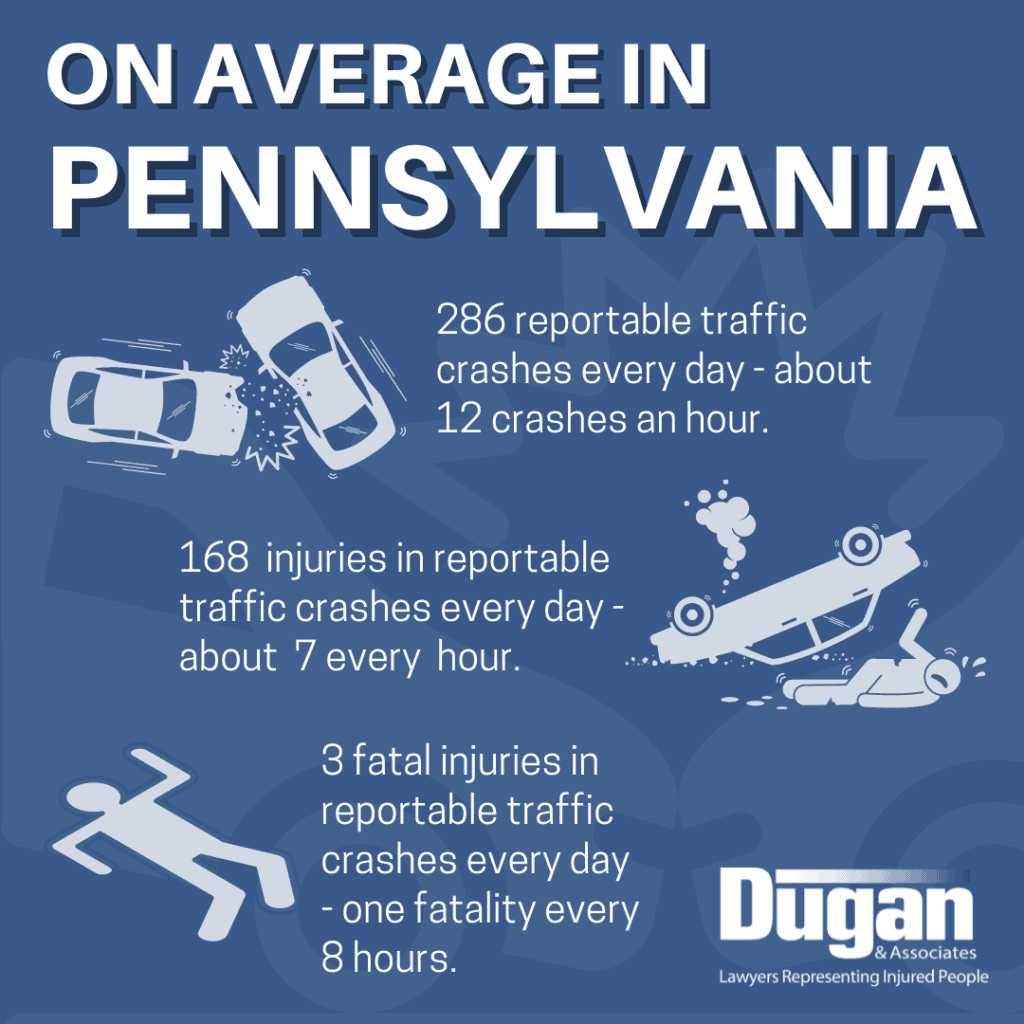
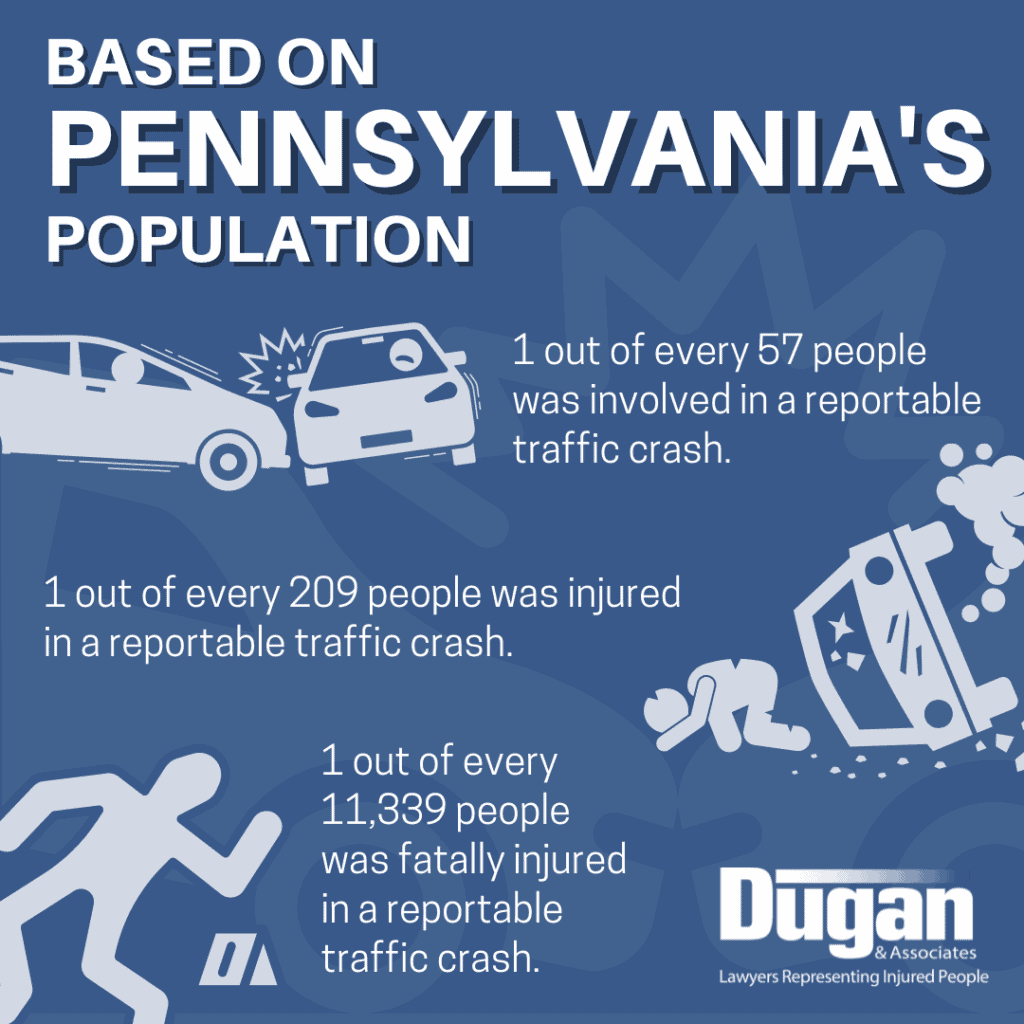
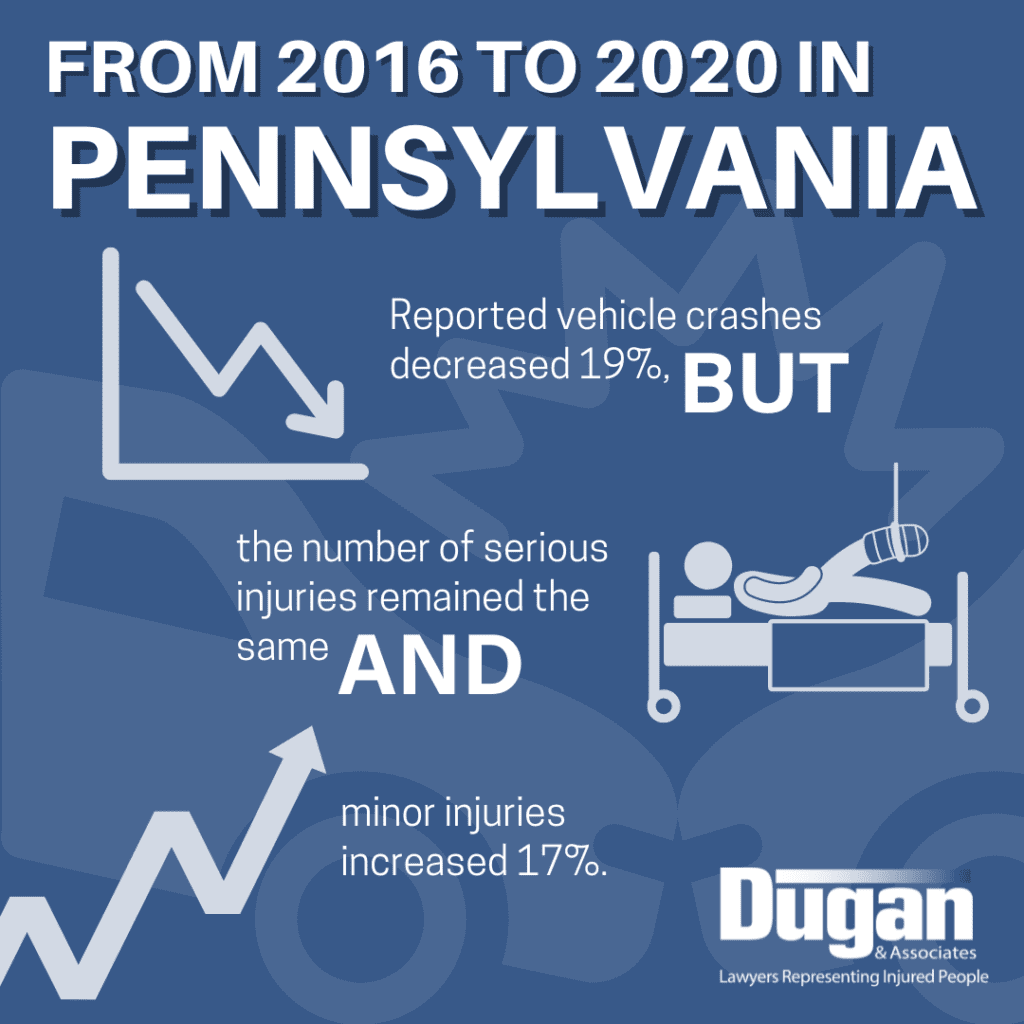
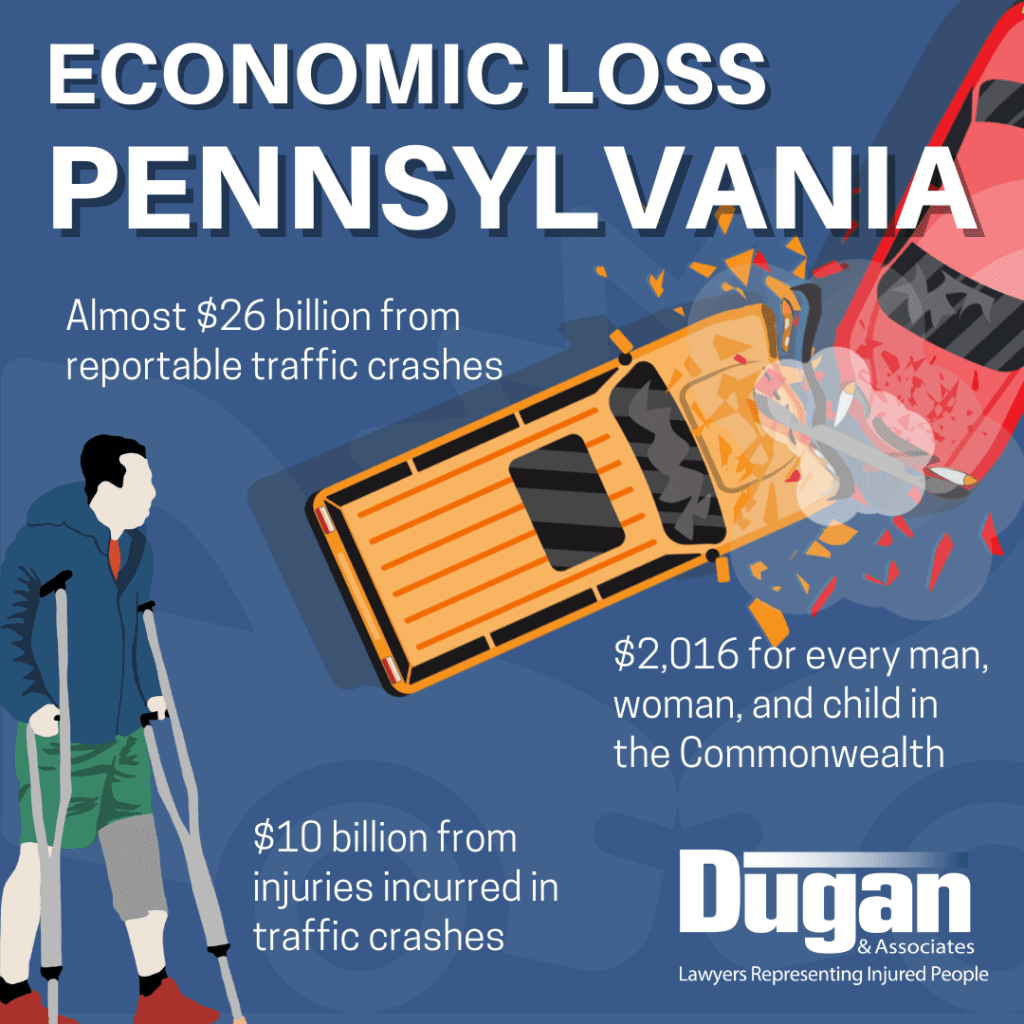
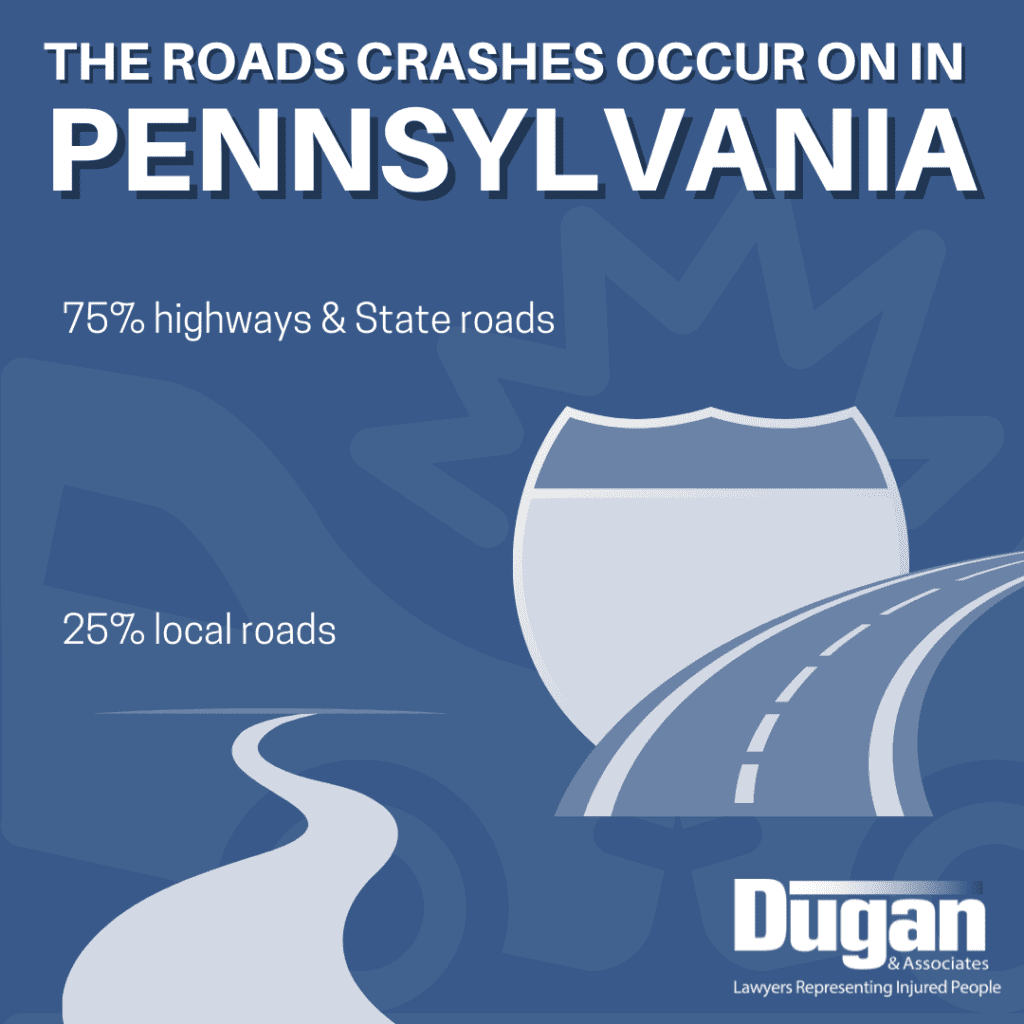
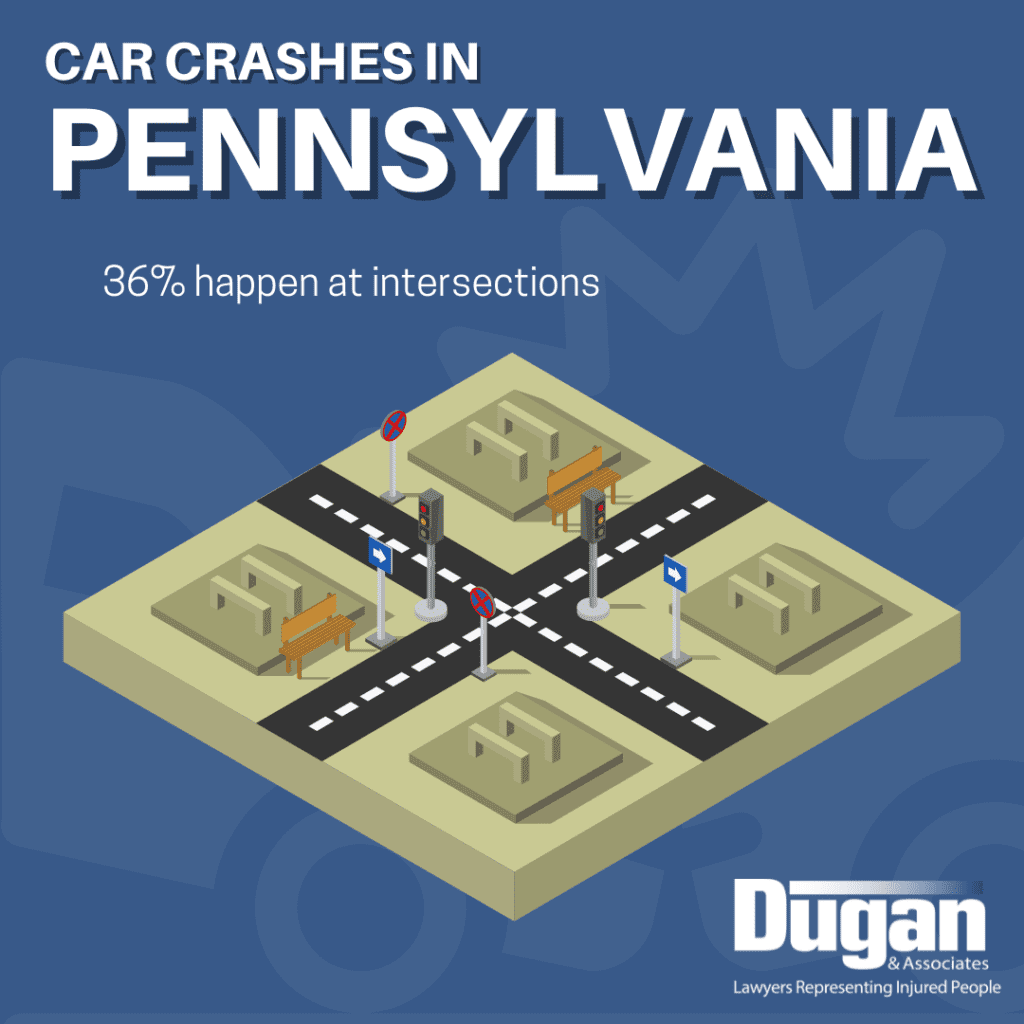
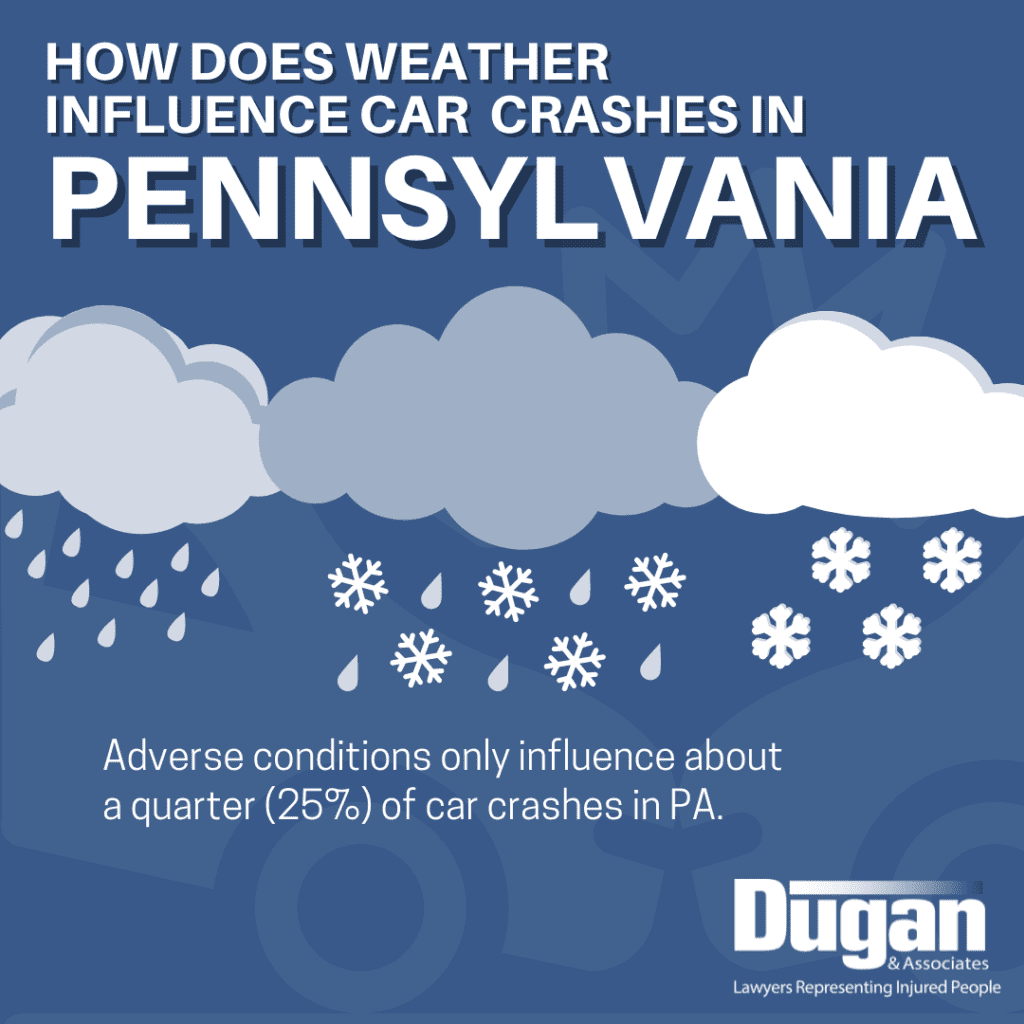
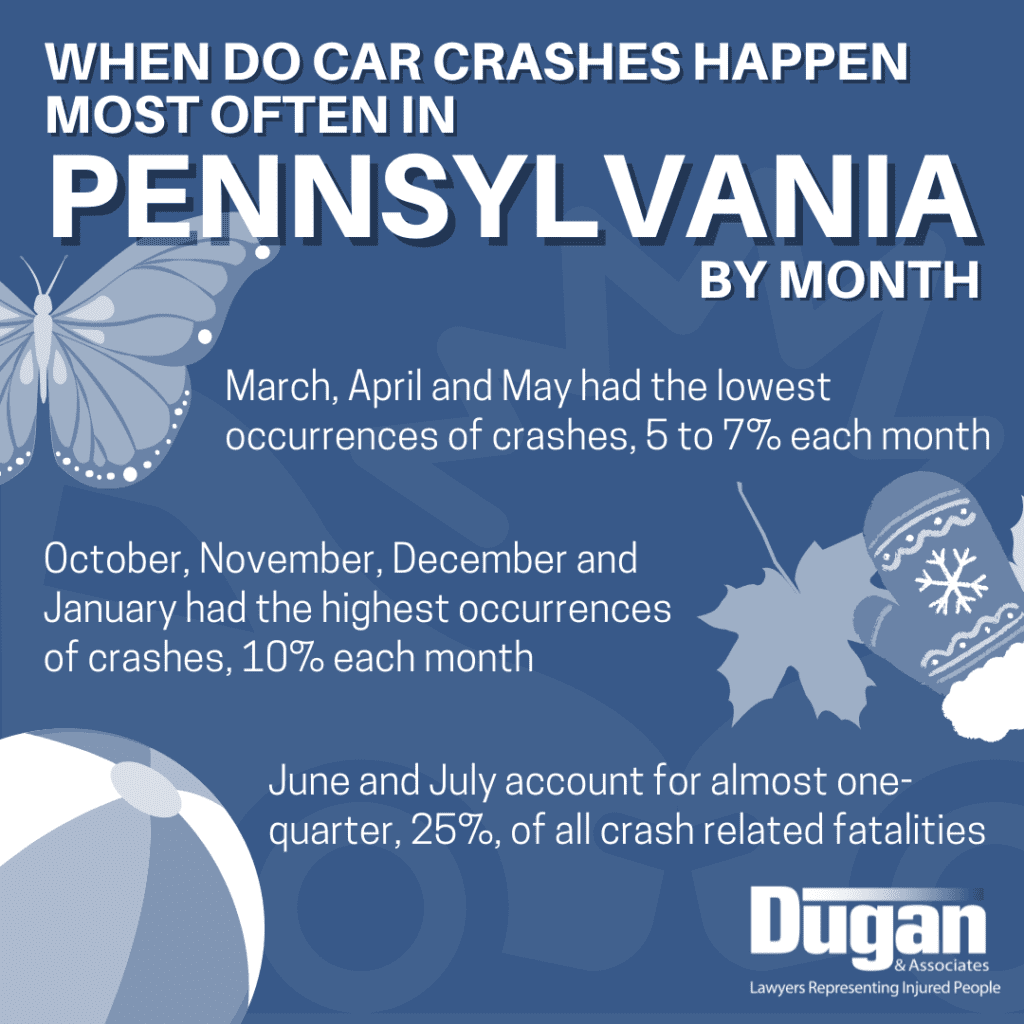
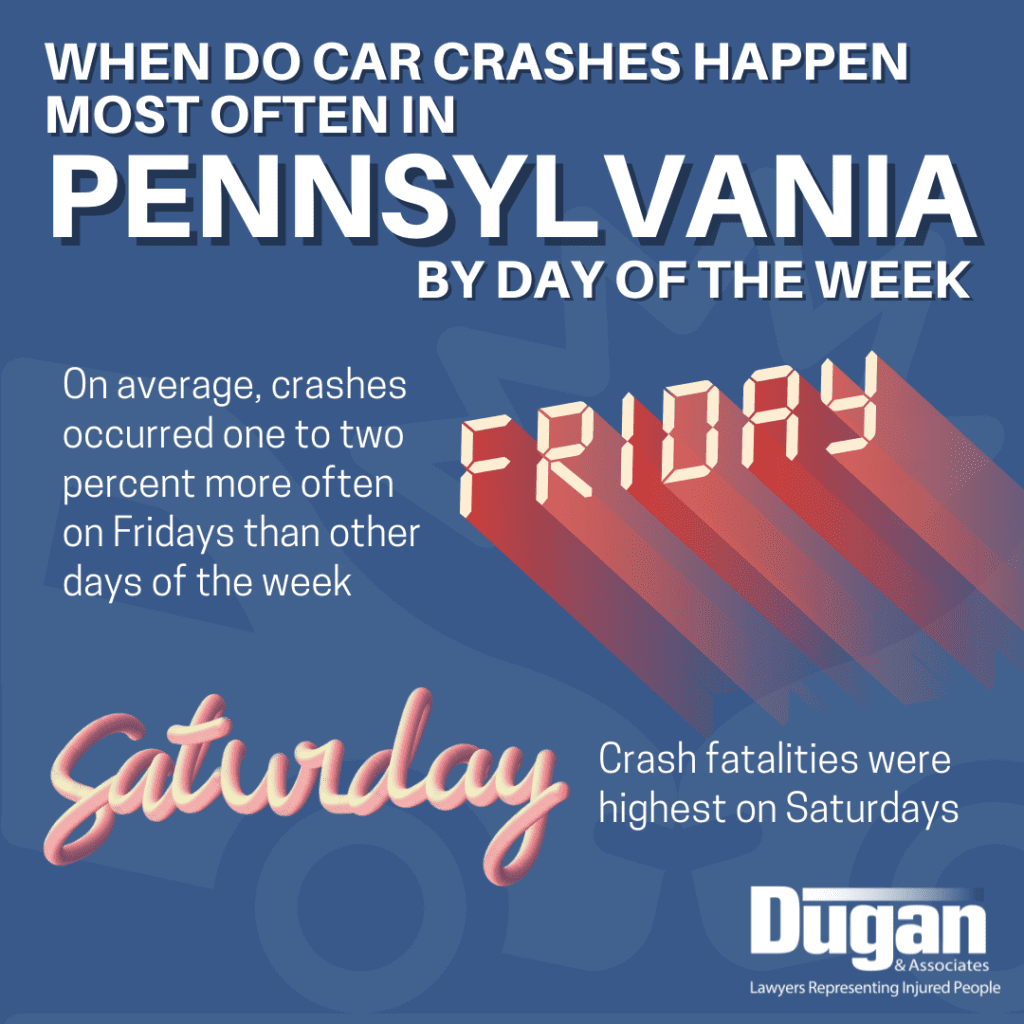
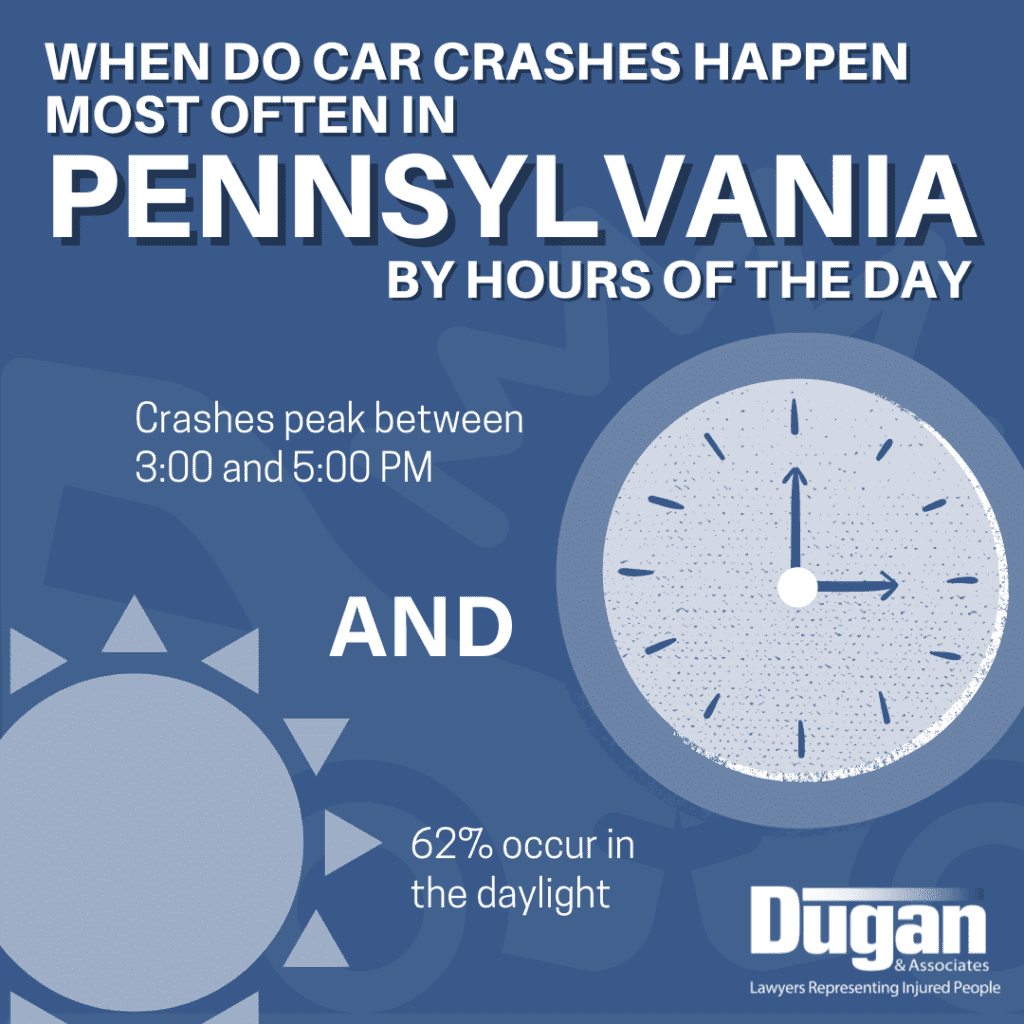
As a Pennsylvania based personal injury law firm with offices in Aliquippa, Canonsburg, Cranberry, Greensburg, Monroeville, Pittsburgh, and Wexford, we’re familiar with the serious pain and suffering a car crash may produce for an individual. We are also aware of a few surprising facts about cars crashes and injuries in Western Pennsylvania. We thought we should share them with you. All the data came from the Pennsylvania Department of Transportation’s 2020 Pennsylvania Crash Facts & Statistics Report.

How Often Do Car Crashes and Injuries Occur in Pennsylvania?

Infographic that reads: On Average in Pennsylvania Each day 286 reportable traffic crashes occurred (about 12 crashes every hour). Each day 3 persons were fatally injured in reportable traffic crashes (one fatality every 8 hours). Each day 168 persons were injured in reportable crashes (about 7 injuries every hour).

How Common Are Car Crashes and Injuries in Pennsylvania?

Infographic that reads: Based on Pennsylvania’s 2019 population (12,801,989 people): 1 out of every 57 people was involved in a reportable traffic crash. 1 out of every 11,339 people was fatally injured in a reportable traffic crash. 1 out of every 209 people was injured in a reportable traffic crash.

What Is the Trend of Car Crashes and Injuries in Pennsylvania?

Infographic that reads: From 2016 to 2020 in Pennsylvania, reported vehicle crashes decreased 19% BUT the number of serious injuries remained the same AND minor injuries increased 17%.

What Is the Economic Loss from Car Crashes & Injuries in Pennsylvania?

Infographic that reads: Total economic loss from reportable traffic crashes in Pennsylvania is almost $26 billion. $2,016 for every man, woman, and child in the Commonwealth. Ten billion dollars from injuries.

What Are the Types of Car Crashes that Occur in Pennsylvania?

Infographic that reads: Types of Crashes in Pennsylvania 31% hit a fixed object 27% crash at an angle 19% are rear end crashes 7% are sideswipes 5% are head on crashes 3% involve pedestrians

What Types of Fixed Objects Do People Crash into in Pennsylvania?

Infographic that reads: Fixed objects people crash into with their vehicles in Pennsylvania 8% parked vehicles 7% utility poles 7% trees or shrubs 6% guiderails 5% embankments 4% deer

What Types of Vehicles Are Involved in Crashes in Pennsylvania?

Infographic that reads: Types of vehicles involved in crashes in Pennsylvania 85% involved passenger vehicles 63% involved light trucks, vans, and SUVs 7% involved heavy trucks 3% involved motorcycles

On What Roads Do Crashes Happen in Pennsylvania?

Infographic that reads: Types of roads crashes occur on in Pennsylvania 75% highways & State roads 25% local roads

Infographic that reads: Car Crashes in Pennsylvania 36% happen at intersections

Who Is Responsible for the Majority of Vehicle Crashes in Pennsylvania?

Infographic that reads: Who causes car crashes in Pennsylvania. Drivers 35 or younger accounted for a little more than half (51%) of all crashes Men were 62% of the drivers involved in crashes in 2020

How Does Weather Influence Car Crashes in Pennsylvania?
Infographic that reads: How does weather influence car crashes in Pennsylvania. Adverse conditions only influence about a quarter (25%) of car crashes in PA. Graphics of rain, fog, sleet, and snow.

When Do Car Crashes Happen Most Often in Pennsylvania?

Infographic that reads: When do car crashes happen most often in Pennsylvania by month March, April and May had the lowest occurrences of crashes, 5 to 7% each month. October, November, December and January had the highest occurrences of crashes, 10% each month. June and July account for almost one-quarter, 25%, of all crash related fatalities.

Infographic that reads: When do car crashes happen most often in Pennsylvania by day of the week. On average, crashes occurred one to two percent more often on Fridays than other days of the week. Crash fatalities were highest on Saturdays.

Infographic that reads: When do car crashes happen most often in Pennsylvania by hours of the day. Crashes peak in Pennsylvania between 3:00 PM and 5:00 PM AND 62% occur in the daylight

What Driver Errors Cause Car Crashes in Pennsylvania?

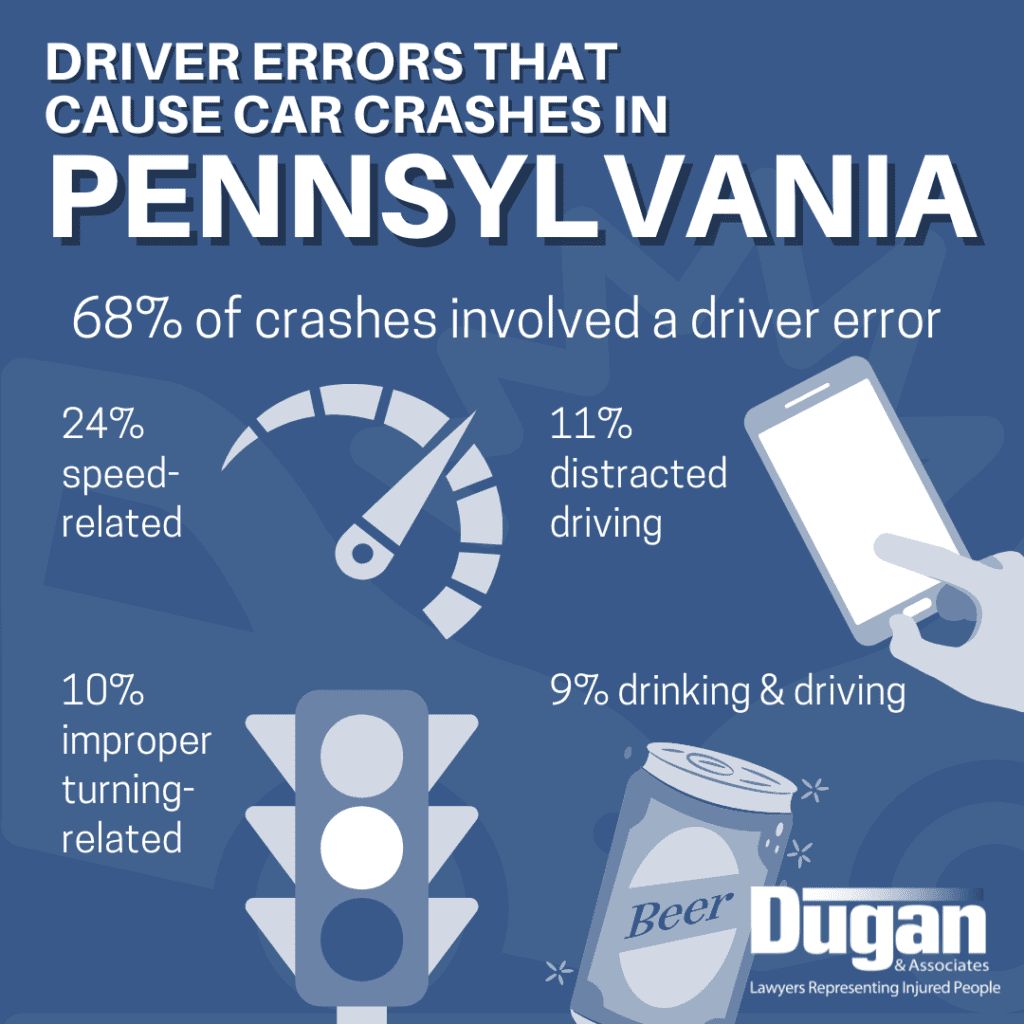
Sixty-eight percent of vehicle crashes in Pennsylvania in 2020 involved a driver error. Let’s look at the most common.

Infographic that reads: Driver errors that cause car crashes in Pennsylvania. 68% of crashes involved a driver error 24% speed-related 11% distracted driving 10% improper turning-related 9% drinking and driving

How Does Alcohol Impact Car Crashes in Pennsylvania?

Infographic that reads: How does alcohol impact car crashes in Pennsylvania. On average each day, 21 alcohol-related traffic crashes occurred. 13 persons were injured in alcohol-related traffic crashes each day.

We Fight for the Check You Deserve When You’re Hurt in a Car Accident

If you or a loved one was hurt in a car accident, contact us. We know the data through and through. Mitch Dugan and his highly skilled and experienced personal injury lawyers at Dugan & Associates will work vigorously to pursue fair and just compensation for loss of earnings, medical expenses, and damages. Consultations are free. If there is not a recovery of compensation, there is also no fee. Contact us today online or by telephone at 412-353-3572.

Think you have a workers’ compensation case?

Contact us

"*" indicates required fields

Name*
One of our attorneys will review your case within 24 hours and we will reach out with the next steps